- Chi tiết
-
Được đăng: 09 Tháng 10 2015
Relative contributions of emphysema and airway remodelling to airflow limitation in COPD: Consistent results from two cohorts.
ABSTRACT
Background and objective: The relative contributions of emphysema and airway remodelling to airflow limitation remain unclear in chronic obstructive pulmonary disease (COPD).We aimed to evaluate the relative contributions of emphysema and airway wall thickness measured by quantitative computed tomography (CT) to the prediction of airflow limitation in two separate COPD cohorts.
Methods: Pulmonary function tests and whole-lung CT were performed in 250 male smokers with COPD, including 167 from University Medical Center at Ho Chi Minh City, Vietnam, and 83 from Shiga University of Medical Science Hospital, Japan. The same CT analysis software was used to measure the percentage of low attenuation volume (%LAV) at the threshold of −950 Hounsfield units and the square root of wall area of a hypothetical airway with an internal perimeter of 10 mm (Pi10). The standardized coefficients in multiple linear regressions were used to evaluate the relative contributions of %LAV and Pi10 to predictions of FEV1/ FVC and FEV1% predicted.
Results: Both %LAV and Pi10 independently predicted either forced expiratory volume in 1 s/forced vital capacity (FEV1/FVC) or FEV1% predicted (P ≤ 0.001 for all standardized coefficients). However, the absolute values of the standardized coefficients were 2−3 times higher for %LAV than for Pi10 in all prediction models. The results were consistent in the two COPD cohorts.
Conclusions: %LAV predicts both FEV1/FVC and FEV1 better than Pi10 in patients with COPD. Thus, emphysema may make a greater contribution to airflow limitation than airway remodelling in COPD.
Key words: airway remodelling, chronic obstructive pulmonary disease, computed tomography, emphysema, quantitative imaging.
Abbreviations: %LAV, percentage of low attenuation volume; COPD, chronic obstructive pulmonary disease; CT, computed tomography; DLCO, diffusing capacity of the lung for carbon monoxide; FEV1, forced expiratory volume in 1 s; FVC, forced vital capacity; HCMC, Ho Chi Minh City; HU, Hounsfield unit; PD15, the lowest 15th percentile point; Pi10, the square root of wall area of a hypothetical airway with an internal perimeter of 10 mm; SD, standard deviation; SUMS, Shiga University of Medical Science; TLC, total lung capacity
SUMMARY AT A GLANCE
We aimed to evaluate the relative contributions of emphysema and airway wall thickness measured by quantitative CT to airflow limitation in COPD. We found that CT-based emphysema predicted airflow limitation better than airway wall thickness. Thus, emphysema may make a greater contribution to airflow limitation than airway remodelling in COPD.
INTRODUCTION
Chronic obstructive pulmonary disease (COPD) is characterized by irreversible airflow limitation, which is demonstrated by a post-bronchodilator FEV1/FVC (ratio of forced expiratory volume in 1 s (FEV1) to forced vital capacity (FVC)) less than 70%.1 The airflow limitation mainly results from obstruction of small airways,2,3 which is the consequence of small airway obliteration due to narrowing and loss of terminal bronchioles,4 airway wall thickening due to airway remodelling and loss of lung elastic recoil due to emphysematous lung destruction.5,6 However, the relative contributions of emphysema and airway remodelling to airflow limitation in COPD remain unclear.5
To fully evaluate morphological changes in patients with COPD, lung specimens are needed. Unfortunately, lung biopsy is not a feasible option for most patients who participate in cross-sectional or longitudinal studies.7 To overcome this obstacle, investigators have used non-invasive modalities including quantitative computed tomography (CT) to indirectly examine those changes.8–10 The extent of emphysema measured by using quantitative CT correlates with that measured macroscopically or microscopically11–13 or with indices of airflow limitation such as FEV1/FVC and FEV1.14–16 Airway wall thickness of relative large airways can also be used to predict that of small conducting airways.17 Furthermore, CT-based emphy- sema and airway wall thickness independently predict FEV1 in COPD.16,18,19 However, little is known about which one makes a greater contribution to that prediction.20 This study was conducted to evaluate the relative contributions of emphysema and airway wall thickness, measured by using three-dimensional CT analysis software, to the prediction of airflow limita- tion in two separate COPD cohorts. Some results of this study have been previously reported as an abstract.21
METHODS
Study design
This is a cross-sectional study in two ongoing COPD cohorts. One recruited COPD patients from the Out- patient Clinic of University Medical Center at Ho Chi Minh City, Vietnam (HCMC cohort),22 from June 2011 to June 2013. Another recruited COPD patients from the Outpatient Clinic of Shiga University of Medical Science Hospital, Japan (SUMS cohort), from June 2012 to June 2013. Each recruited patient underwent a complete medical interview, physical examination, pulmonary function tests and whole-lung CT on the same day. This study was conducted in accordance with the amended Declaration of Helsinki. The study protocol was approved by the ethics committee of each participating institution. Written informed consent was obtained from all patients.
Study patients
Patients were recruited if they met all of the following criteria: age between 40 and 85 years, former or current cigarette smokers with more than 10 pack- years and definitive diagnosis of COPD according to the Global Initiative for Chronic Obstructive Lung Disease guidelines.1 Patients were excluded for any of the following reasons: female (COPD is rare in women in both cohorts), a history of asthma, COPD exacer- bations within 6 weeks, chronic respiratory failure, and abnormalities on plain chest X-ray other than emphysema and/or minor linear opacities. Pulmonary function tests
In the HCMC cohort, all patients underwent spirometry and measurement of diffusing capacity of the lung for carbon monoxide (DLCO) following American Thoracic Society/European Respiratory Society recommendations,23,24 as described elsewhere.22 Because the spirometric reference values for the Vietnamese are not currently available, all post-bronchodilator parameters except FEV1/FVC are presented as percentages of the predicted values based on the NHANES III equations25 with a correction factor of 0.88.26
In the SUMS cohort, all patients underwent spirometry and measurement of DLCO using FUDAC- 77 (Fukuda Denshi, Tokyo, Japan) before and after inhaling 20 μg procaterol. All manoeuvres met Japanese Respiratory Society standards. Post- bronchodilator parameters except FEV1/FVC are presented as percentages of the predicted values based on the Japanese reference equations.27
Quantitative CT analysis
In the HCMC cohort, all patients were scanned by using the same 64-slice CT scanner, Toshiba Aquilion 64 (Toshiba Corp., Tokyo, Japan), as previously reported.22
In the SUMS cohort, all patients were scanned by using the same 320-slice CT scanner, Toshiba Aquilion ONE. The CT scanning protocol was non- contrast, spiral mode, pitch of 0.906, 120 kVp, 210 mA, rotation time of 0.5 s, collimation of 0.5 mm, at suspended full inspiration, from apex to bottom of the lungs. CT images were reconstructed with 1-mm slice thickness, 0.5-mm interval, 350-mm field of view, 512 × 512 matrix and FC03 kernel.
All CT images of the two cohorts were analysed by using Apollo 1.2 software (VIDA diagnostics, Coralville, IA, USA; http://www.vidadiagnostics .com)28–30 at a laboratory of the SUMS.
The extent of emphysema was measured by density mask and percentile point methods. For the density mask method, emphysema was defined as the percentage of lung volume with CT attenuation value below −950 Hounsfield units (HU)31—known as percentage of low attenuation volume (%LAV) at the threshold of −950 HU (Supplementary Fig. S1a). For the percentile point method, emphysema was defined as the lowest 15th percentile point (PD15)32 at which 15% of lung density is distributed below it on the histogram of the whole lungs.
All visible airways in both lungs up to the fifth generation—subsubsegmental bronchi—were segmented and measured (Supplementary Fig. S1b,c). Because the software has been validated on physical phantoms with internal perimeter >6 mm29 and the majority of bronchial segments with the third generation have internal perimeter <20 mm, only bronchial segments with internal perimeters from 6 to 20 mm were selected for estimating the square root of wall area of a hypothetical airway with an internal perimeter of 10 mm (Pi10)—a standardized index of airway wall thickness.19 Pi10 is calculated from the linear regression in which the square root of wall area of each measured segment is plotted against its internal perimeter (Supplementary Fig. S1d).17
Patients with noisy CT images or lung abnormalities other than emphysema were excluded from the statistical analysis. More details about the quantitative CT analysis are provided in the Supplementary Appendix S1.
Table 1 Clinical and pulmonary function characteristics of 250 COPD patients
|
Clinical and pulmonary function characteristics |
HCMC cohort (n = 167) |
SUMS cohort (n = 83) |
P-value† |
|
Age, years |
63.2 ± 10.5 |
73.3 ± 7.7 |
<0.001 |
|
Smoking index, pack-years |
37.3 ± 13.9 |
62.9 ± 32.4 |
<0.001 |
|
Former smokers |
111(66.5%) |
68(81.9%) |
|
|
Current smokers |
56(33.5%) |
15(18.1%) |
0.009 |
|
Height, m |
1.62 ± 0.06 |
1.64 ± 0.07 |
0.024 |
|
Weight, kg |
55.5 ± 10.1 |
62.4 ± 8.5 |
<0.001 |
|
Body mass index, kg/m2 |
21.1 ± 3.4 |
23.2 ± 2.6 |
<0.001 |
|
TLC, L‡ |
4.53 ± 0.87 |
5.60 ± 0.85 |
<0.001 |
|
TLC, % predicted‡ |
87.6 ± 13.2 |
100.3 ± 13.5 |
<0.001 |
|
FVC, L |
2.62 ± 0.78 |
3.30 ± 0.75 |
<0.001 |
|
FVC, % predicted |
77.7 ± 18.2 |
103.3 ± 20.3 |
<0.001 |
|
FEV1/FVC, % |
48.2 ± 11.1 |
50.7 ± 13.1 |
0.136 |
|
FEV1, L |
1.29 ± 0.57 |
1.70 ± 0.67 |
<0.001 |
|
FEV1, % predicted |
52.0 ± 19.7 |
63.4 ± 22.4 |
<0.001 |
|
DLCO, mL/min/mm Hg‡ |
13.24 ± 5.76 |
11.68 ± 4.64 |
0.040 |
|
DLCO, % predicted‡ |
56.4 ± 20.1 |
76.8 ± 26.1 |
<0.001 |
|
DLCO/VA, mL/min/mm Hg/L‡ |
3.01 ± 1.09 |
2.66 ± 1.00 |
0.023 |
|
GOLD stage: I |
17(10.2%) |
21(25.3%) |
0.014 |
|
II |
71(42.5%) |
34(41.0%) |
|
|
III |
61(36.5%) |
23(27.7%) |
|
|
IV |
18(10.8%) |
5(6.0%) |
|
Data are mean ± SD or n (%).
† Comparisons between the two cohorts by the Student’s t-test or a chi-square test, as appropriate.
‡ From 110 COPD patients in the HCMC cohort and 81 COPD patients in the SUMS cohort.
COPD, chronic obstructive pulmonary disease; DLCO, diffusing capacity of the lung for carbon monoxide; FEV1, forced expiratory volume in 1 s; FVC, forced vital capacity; GOLD, Global Initiative for Chronic Obstructive Lung Disease; HCMC, Ho Chi Minh City; SD, standard deviation; SUMS, Shiga University of Medical Science; TLC, total lung capacity; VA, alveolar volume.
Statistical analysis
Correlations between CT measures and pulmonary function parameters were evaluated using the Spear- man’s correlation coefficient. The relative contributions of emphysema (%LAV or PD15) and airway wall thickness (Pi10) to the prediction of airflow limitation were evaluated by using standardized regression coefficient and squared semipartial correlation (also called semipartial coefficient) in multiple linear regressions. The absolute value of a given standardized coefficient refers to how many standard devia- tions (SD) an outcome variable would change per SD increase in a given predictor.33 A given semipartial coefficient expresses the unique contribution of a given predictor to the total variability of an outcome variable.34 These coefficients allow comparing the relative contributions between variables with different scale units in a certain prediction model.
The multiple regression analyses were first explored in the HCMC cohort and then validated in the SUMS cohort to avoid bias due to ethnicity, participating institution, CT scanner and CT scanning protocol. A P-value < 0.05 was considered statistically significant. Statistical analysis was done by using IBM SPSS Sta- tistics 20 (IBM Corp., Armonk, NY, USA). More details about the statistical analysis are provided in Supplementary Appendix S1.
RESULTS
Study patients
Among patients recruited, 167 in the HCMC cohort and 83 in the SUMS cohort were included in the statistical analysis. In the HCMC cohort, 30 out of 197 (15.2%) patients were excluded from the statistical analysis; the most common reason was noisy CT images (Supplementary Table S1). Patients in the HCMC cohort were younger and shorter, smoked less and had a lower total lung capacity (TLC) than those in the SUMS cohort (Table 1). The mean FEV1% predicted and mean DLCO% predicted were lower in the HCMC than in the SUMS cohort. However, the mean FEV1/FVC was not different between the two cohorts.
Univariate analysis of CT measures
The extent of emphysema measured as %LAV or PD15 was less severe, but the airway wall thickness measured as Pi10 was thicker in the HCMC than in the SUMS cohort (Table 2). %LAV had no correlation with Pi10 in either the HCMC (rho = −0.11, P = 0.160) or the SUMS cohort (rho = −0.07, P = 0.550). %LAV was negatively correlated with FEV1/FVC, FEV1% predicted and DLCO% predicted in the two cohorts (Table 3). Pi10 was negatively correlated with FEV1% predicted, but was not with DLCO% predicted in the two cohorts. The correlation between Pi10 and FEV1/FVC was significant in the HCMC cohort, but was not significant in the SUMS cohort. The strengths of the association with FEV1% predicted were stronger for %LAV than for Pi10 in both cohorts (Fig. 1).
Table 2 Computed tomography (CT) characteristics of 250 COPD patients
|
CT characteristics |
HCMC cohort (n = 167) |
SUMS cohort (n = 83) |
P-value† |
|
Mean lung density, HU |
−832.3 ± 30.3 |
−849.8 ± 28.2 |
<0.001 |
|
Total lung volume, L |
5.128 ± 0.969 |
5.360 ± 1.019 |
0.086 |
|
PD15, HU |
−916.3 ± 26.1 |
−942.6 ± 25.6 |
<0.001 |
|
%LAV, % |
1.4 (0.4, 6.7) |
9.0 (4.2, 20.6) |
<0.001 |
|
Pi10, mm |
3.78 ± 0.13 |
3.75 ± 0.09 |
0.035 |
Data are mean ± SD or median (25th, 75th percentiles). Lower PD15 indicates more severe emphysema while higher %LAV indicates more severe emphysema.
† Comparison between the two cohorts by the Student’s t-test or Wilcoxon test, as appropriate.
COPD, chronic obstructive pulmonary disease; HCMC, Ho Chi Minh City; HU, Hounsfield unit; %LAV, percentage of low attenuation volume; PD15, the lowest 15th percentile point; Pi10, the square root of wall area of a hypothetical airway with an internal perimeter of 10 mm; SD, standard deviation; SUMS, Shiga University of Medical Science.
Table 3 Correlation between each CT measure and each pulmonary function parameter in two COPD cohorts
|
Pulmonary function parameters |
HCMC cohort (n = 167) |
SUMS cohort (n = 83) |
||
|
%LAV, % |
Pi10, mm |
%LAV, % |
Pi10, mm |
|
|
FVC, % predicted |
−0.19 (0.013) |
−0.28 (<0.001) |
−0.13 (0.260) |
−0.23 (0.037) |
|
FEV1/FVC, % |
−0.61 (<0.001) |
−0.18 (0.021) |
−0.60 (<0.001) |
−0.17 (0.120) |
|
FEV1, % predicted |
−0.46 (<0.001) |
−0.25 (0.001) |
−0.48 (<0.001) |
−0.24 (0.031) |
|
DLCO, % predicted† |
−0.71 (<0.001) |
0.01 (0.945) |
−0.52 (<0.001) |
−0.08 (0.452) |
|
DLCO/VA, mL/min/mm Hg/L† |
−0.74 (<0.001) |
0.09 (0.348) |
−0.65 (<0.001) |
−0.08 (0.496) |
Data are the Spearman’s correlation coefficient (P-value).
† From 110 COPD patients in the HCMC cohort and 81 COPD patients in the SUMS cohort.
COPD, chronic obstructive pulmonary disease; CT, computed tomography; DLCO, diffusing capacity of the lung for carbon monoxide; FEV1, forced expiratory volume in 1 s; FVC, forced vital capacity; HCMC, Ho Chi Minh City; %LAV, percentage of low attenuation volume; Pi10, the square root of wall area of a hypothetical airway with an internal perimeter of 10 mm; SUMS, Shiga University of Medical Science; VA, alveolar volume.
Relative contributions of CT measures
Using standard multiple regressions, both %LAV and Pi10 independently predicted either FEV1/FVC (Table 4) or FEV1% predicted (Table 5) in both COPD cohorts. However, %LAV predicted both FEV1/FVC and FEV1 better than Pi10, as indicated by higher absolute values of the standardized coefficients or higher semipartial coefficients for %LAV than for Pi10. In the HCMC cohort, FEV1/FVC declined 2.8 times greater for each SD increase in log(%LAV) (by 0.65 SD) than in Pi10 (by only 0.23 SD); the total variability of FEV1/FVC was explained 40.6% by log(%LAV), but only 5.1% by Pi10 (Table 4). In the SUMS cohort, FEV1/FVC declined 2.7 times greater for each SD increase in %LAV (by 0.73 SD) than in Pi10 (by only 0.27 SD); the total variability of FEV1/FVC was explained 51.6% by %LAV, but only 6.9% by Pi10. Similarly, in the HCMC cohort, FEV1% predicted declined 2.1 times greater for each SD increase in log(%LAV) than in Pi10; the total variability of FEV1% predicted was explained 23.2% by log(%LAV), but only 6.6% by Pi10 (Table 5). In the SUMS cohort, FEV1% predicted declined 1.9 times greater for each SD increase in %LAV than in Pi10; the total variability of FEV1% predicted was explained 34.1% by %LAV, but only 13.4% by Pi10.
When %LAV was replaced with PD15 as an index of emphysema, the results were repeatable for both FEV1/FVC (Supplementary Table S2) and FEV1% predicted (Supplementary Table S3), except that PD15 was positively correlated with indices of airflow limitation.
DISCUSSION
Results of this study show that both %LAV and Pi10 independently predicted either FEV1/FVC or FEV1% predicted. However, %LAV predicted both FEV1/FVC and FEV1 better than Pi10. The results were consistent in two separate COPD cohorts, which differed by ethnicity, mean age, mean FEV1% predicted and mean CT measures. The finding that both %LAV and Pi10 were independent predictors of FEV1% predicted is consistent with findings from previous studies, which used two- dimensional CT analysis software to measure the same CT measures.18,19 However, the present study further demonstrates that both %LAV and Pi10 were also independent predictors of FEV1/FVC, an index of airflow limitation adjusted for lung size.35 Results of this study also support the finding of another study, which concluded that emphysema and percentage of airway wall thickness were independently related to airflow limitation.16 However, the results of this study could be generalizable to smokers with COPD, not to all smokers with and without COPD as in the previous study.
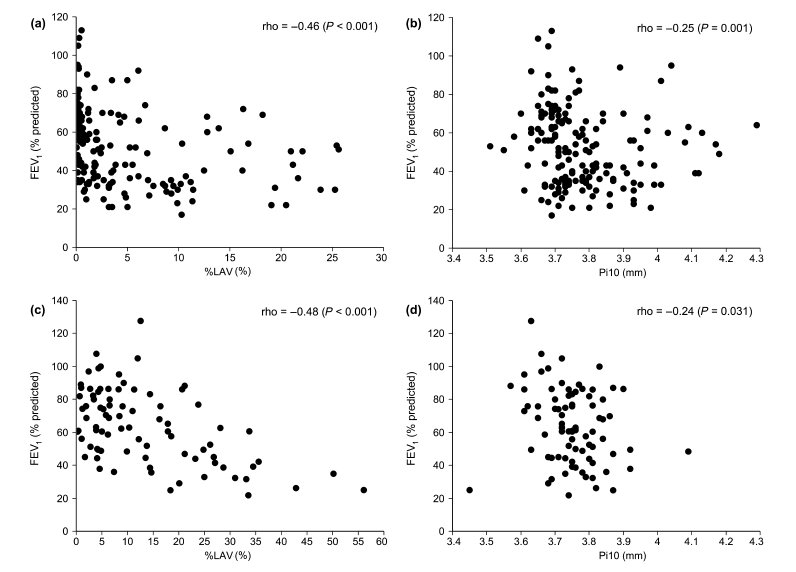
Figure 1 Scatterplots of the association between computed tomography (CT) measures and forced expiratory volume in 1 s (FEV1)% predicted in the (a, b) Ho Chi Minh City (HCMC) and (c, d) Shiga University of Medical Science (SUMS) cohorts. %LAV, percentage of low attenuation volume; Pi10, the square root of wall area of a hypothetical airway with an internal perimeter of 10 mm.
The novel finding of the present study is that %LAV predicted both FEV1/FVC and FEV1 better than Pi10 in COPD. This finding is consistent in the two separate COPD cohorts and supported by both univariate and multivariate analyses. This helps clarify the finding from a previous study that %LAV had a greater influence than Pi10 on BODE index, which includes FEV1% predicted.36 The finding that %LAV predicted FEV1/ FVC better than Pi10 is in agreement with that of a recent study by Mohamed Hoesein et al.,20 but not the finding that Pi10 predicted FEV1 better than %LAV.20 The discrepancy may result from the fact that FEV1 is presented as post-bronchodilator value in the present study but as pre-bronchodilator value in the Mohamed Hoesein et al.’s study and that all male smokers in the present study have COPD while most male smokers in that study do not have COPD, and thus, their %LAV is insignificant.
Table 4 Relative contributions of CT measures to predictions of FEV1/FVC by standard multiple regressions†
|
Parameters of prediction model |
HCMC cohort (n = 167) |
SUMS cohort (n = 83) |
||
|
%LAV‡ |
Pi10 |
%LAV‡ |
Pi10 |
|
|
Unstandardized coefficient (95% CI) |
−9.95 (−11.79, −8.12) |
−19.4 (−29.5, −9.3) |
−0.79 (−0.96, −0.62) |
−39.3 (−62.0, −16.6) |
|
Standardized coefficient§ |
−0.65 |
−0.23 |
−0.73 |
−0.27 |
|
Semi-partial coefficient¶ |
0.406 |
0.051 |
0.516 |
0.069 |
|
P value†† |
<0.001 |
<0.001 |
<0.001 |
0.001 |
† The adjusted R2 was 0.412 for the HCMC cohort and 0.534 for the SUMS cohort.
‡ %LAV in the HCMC cohort was log-transformed.
§ The absolute value refers to how many SD FEV1/FVC would decrease per SD increase in the predictor.
¶ The value expresses the unique contribution of the predictor to the total variability of FEV1/FVC.
†† Significantly different from zero, applied for the three coefficients at the same time.
CI, confidence interval; CT, computed tomography; FEV1, forced expiratory volume in 1 s; FVC, forced vital capacity; HCMC, Ho Chi Minh City; %LAV, percentage of low attenuation volume; Pi10, the square root of wall area of a hypothetical airway with an internal perimeter of 10 mm; SD, standard deviation; SUMS, Shiga University of Medical Science.
Table 5 Relative contributions of CT measures to predictions of FEV1% predicted by standard multiple regressions†
|
Parameters of prediction model |
HCMC cohort (n = 167) |
SUMS cohort (n = 83) |
||
|
%LAV‡ |
Pi10 |
%LAV‡ |
Pi10 |
|
|
Unstandardized coefficient (95% CI) |
−13.28 (−17.00, −9.56) |
−35.3 (−55.8, −14.8) |
−1.10 (−1.43, −0.77) |
−78.9 (−123.5, −34.2) |
|
Standardized coefficient§ |
−0.48 |
−0.23 |
−0.59 |
−0.31 |
|
Semi-partial coefficient¶ |
0.232 |
0.066 |
0.341 |
0.134 |
|
P value†† |
<0.001 |
0.001 |
<0.001 |
0.001 |
† The adjusted R2 was 0.241 for the HCMC cohort and 0.369 for the SUMS cohort.
‡ %LAV in the HCMC cohort was log-transformed.
§ The absolute value refers to how many SD FEV1% predicted would decrease per SD increase in the predictor.
¶ The value expresses the unique contribution of the predictor to the total variability of FEV1% predicted.
†† Significantly different from zero, applied for the three coefficients at the same time.
CI, confidence interval; CT, computed tomography; FEV1, forced expiratory volume in 1 s; HCMC, Ho Chi Minh City; %LAV, percentage of low attenuation volume; Pi10, the square root of wall area of a hypothetical airway with an internal perimeter of 10 mm; SD, standard deviation; SUMS, Shiga University of Medical Science
There are several possible explanations for why %LAV predicted both FEV1/FVC and FEV1 better than Pi10 in COPD. First, %LAV reflects emphysematous lesions,12,31 which result in loss of lung elastic recoil. In this instance, the loss of lung elastic recoil may be a stronger determinant of airflow limitation than airway wall thickening. Second, Pi10 only reflects small airway wall thickening,17 which is one component of small airway obstruction. There is evidence that small airway obstruction in COPD also results from complete obliteration of small airways4 as well as the accumulation of inflammatory mucous exu- dates within the lumen.2 Neither of these is captured by Pi10. Finally, airway wall may not be thickened in all COPD patients.37
Results of the present study suggest that emphy-sema may make a greater contribution to airflow limitation in COPD than airway remodelling. This implication has been corroborated in some longitudinal studies, which have showed that %LAV plays a greater role as a biomarker than Pi10. A greater extent of emphysema on baseline CT is associated with a greater decline in FEV1 in smokers38 or in subjects with established COPD.39 In addition, %LAV has been shown to predict respiratory-related mortality40 and all-cause mortality in COPD while Pi10 has not.41 This implication also means that interventions targeting emphysema may result in better outcomes than those targeting airway remodelling in patients with COPD.
Because the results were consistent in two COPD cohorts with different baseline characteristics and CT scanning protocols, the results may be generalized to other Asian COPD populations. The fact that Vietnamese patients have smaller lungs (lower TLC) makes their FEV1% predicted worse than Japanese patients, even though FEV1/FVC was similar. The differences in age, pack-years of smoking42 and CT scanning protocol may make %LAV lower in the HCMC than in the SUMS cohort. The threshold of −950 HU to define emphysema may underestimate %LAV in the Vietnamese, whereas it may not in the Japanese. Nevertheless, the results in this study are robust because %LAVs generated by different thresholds are certainly correlated with each other. In addition, when replacing %LAV with PD15, the results were repeatable in both cohorts.
This study has some limitations. First, the sample size of each cohort is relatively small. The associations in Table 3 could be strengthened if the sample size of each cohort was larger. Second, %LAV and Pi10 explained only 24–53% of the total variability of airflow limitation. It is likely that these CT measures are indirect and incomplete indices of the structural and functional changes that contribute to airflow limitation in COPD.2,4 The adjusted R2 in Tables 4 and 5 could be greater if an index of air trapping assessed by inspiratory/expiratory CT scans, which is also associated with airflow limitation,20,43 is added to the prediction models. Finally, Pi10 reflects the wall thick- ness of airways with an internal diameter of ∼3 mm, not the small airways with internal diameter <2 mm that are the main site of airway obstruction in COPD.6 However, Pi10 has been shown to be related with airway thickening of small airways evaluated by histology.17
In conclusion, %LAV predicted both FEV1/FVC and FEV1 better than Pi10 in patients with COPD. Thus, emphysema may make a greater contribution to airflow limitation than airway remodelling in COPD.
NGUYEN VAN THO,1,3* YASUSHI RYUJIN,1* EMIKO OGAWA,1,2 LE THI HUYEN TRANG,3 RIE KANDA,1 KENICHI GOTO,1 MASAFUMI YAMAGUCHI,1 TAISHI NAGAO,1 LE THI TUYET LAN3 AND YASUTAKA NAKANO1
1 Division of Respiratory Medicine, Department of Medicine, 2Health Administration Center, Shiga University of Medical Science, Shiga, Japan, and 3Respiratory Care Center, University Medical Center, Ho Chi Minh City, Vietnam
Acknowledgements
The study was partially funded by JSPS KAKENHI Grant No. 18590847. The authors would like to thank the staff of the Respiratory Care Center, University Medical Center at Ho Chi Minh City, Vietnam, for recruiting the patients. The authors also want to thank Prof. Peter D. Paré, MD, James Hogg Research Center, University of British Columbia, Vancouver, Canada, for helpful comments on the manuscript.
REFERENCES
1 GOLD. The global strategy for the diagnosis, management, and prevention of COPD. Global Initiative for Chronic Obstructive Lung Disease (GOLD) 2014. 2014. [Accessed 4 Jun 2014.] Available from URL: http://www.goldcopd.org/.
2 Hogg JC, Chu F, Utokaparch S, Woods R, Elliott WM, Buzatu L, Cherniack RM, Rogers RM, Sciurba FC, Coxson HO et al. The nature of small-airway obstruction in chronic obstructive pulmonary disease. N. Engl. J. Med. 2004; 350: 2645–53.
3 Hogg JC, Macklem PT, Thurlbeck WM. Site and nature of airway obstruction in chronic obstructive lung disease. N. Engl. J. Med. 1968; 278: 1355–60.
4 McDonough JE, Yuan R, Suzuki M, Seyednejad N, Elliott WM, Sanchez PG, Wright AC, Gefter WB, Litzky L, Coxson HO et al. Small-airway obstruction and emphysema in chronic obstructive pulmonary disease. N. Engl. J. Med. 2011; 365: 1567–75.
5 Barnes PJ, Shapiro SD, Pauwels RA. Chronic obstructive pulmonary disease: molecular and cellular mechanisms. Eur. Respir. J. 2003; 22: 672–88.
6 Hogg JC. Pathophysiology of airflow limitation in chronic obstructive pulmonary disease. Lancet 2004; 364: 709–21.
7 Coxson HO, Rogers RM. Quantitative computed tomography of chronic obstructive pulmonary disease. Acad. Radiol. 2005; 12: 1457–63.
8 Coxson HO. Quantitative computed tomography assessment of airway wall dimensions: current status and potential applications for phenotyping chronic obstructive pulmonary disease. Proc. Am. Thorac. Soc. 2008; 5: 940–5.
9 Coxson HO, Mayo J, Lam S, Santyr G, Parraga G, Sin DD. New and current clinical imaging techniques to study chronic obstructive pulmonary disease. Am. J. Respir. Crit. Care Med. 2009; 180: 588– 97.
10 Van Tho N, Wada H, Ogawa E, Nakano Y. Recent findings in chronic obstructive pulmonary disease by using quantitative computed tomography. Respir. Investig. 2012; 50: 78–87.
11 Gevenois PA, de Maertelaer V, De Vuyst P, Zanen J, Yernault JC. Comparison of computed density and macroscopic morphometry in pulmonary emphysema. Am. J. Respir. Crit. Care Med. 1995; 152: 653–7.
12 Madani A, Zanen J, de Maertelaer V, Gevenois PA. Pulmonary emphysema: objective quantification at multi-detector row CT–comparison with macroscopic and microscopic morphometry. Radiology 2006; 238: 1036–43.
13 Muller NL, Staples CA, Miller RR, Abboud RT. Density mask’. An objective method to quantitate emphysema using computed tomography. Chest 1988; 94: 782–7.
14 Camiciottoli G, Bartolucci M, Maluccio NM, Moroni C, Mascalchi M, Giuntini C, Pistolesi M. Spirometrically gated high resolution CT findings in COPD: lung attenuation vs lung function and dyspnea severity. Chest 2006; 129: 558–64.
15 Cerveri I, Dore R, Corsico A, Zoia MC, Pellegrino R, Brusasco V, Pozzi E. Assessment of emphysema in COPD: a functional and radiologic study. Chest 2004; 125: 1714–18.
16 Nakano Y, Muro S, Sakai H, Hirai T, Chin K, Tsukino M, Nishimura K, Itoh H, Pare PD, Hogg JC et al. Computed tomographic measurements of airway dimensions and emphysema in smokers. Correlation with lung function. Am. J. Respir. Crit. Care Med. 2000; 162: 1102–8.
17 Nakano Y, Wong JC, de Jong PA, Buzatu L, Nagao T, Coxson HO, Elliott WM, Hogg JC, Pare PD. The prediction of small airway dimensions using computed tomography. Am. J. Respir. Crit. Care
Med. 2005; 171: 142–6.
18 Kim WJ, Silverman EK, Hoffman E, Criner GJ, Mosenifar Z, Sciurba FC, Make BJ, Carey V, Estepar RS, Diaz A et al. CT metrics of airway disease and emphysema in severe COPD. Chest 2009; 136: 396–404.
19 Patel BD, Coxson HO, Pillai SG, Agusti AG, Calverley PM, Donner CF, Make BJ, Muller NL, Rennard SI, Vestbo J et al.; International COPD Genetics Network. Airway wall thickening and emphysema show independent familial aggregation in chronic obstructive pulmonary disease. Am. J. Respir. Crit. Care Med. 2008; 178: 500–5.
20 Mohamed Hoesein FA, de Jong PA, Lammers JW, Mali WP, Mets OM, Schmidt M, de Koning HJ, Aalst C, Oudkerk M, Vliegenthart R et al. Contribution of CT quantified emphysema, air trapping and airway wall thickness on pulmonary function in male smokers with and without COPD. COPD 2014; 11: 503–9.
21 Tho NV, Ogawa E, Ryujin Y, Kanda R, Nagao T, Oguma T, Yamaguchi M, Ito M, Fukunaga K, Nakagawa H et al. Relative contribution of CT-based emphysema and airway wall area in predicting airflow limitation in COPD [abstract]. Respirology 2013; 18: OS119.
22 Tho NV, Trang le TH, Murakami Y, Ogawa E, Ryujin Y, Kanda R, Nakagawa H, Goto K, Fukunaga K, Higami Y et al. Airway wall area derived from 3-dimensional computed tomography analysis differs among lung lobes in male smokers. PLoS ONE 2014; 9: e98335.
23 Macintyre N, Crapo RO, Viegi G, Johnson DC, van der Grinten CP, Brusasco V, Burgos F, Casaburi R, Coates A, Enright P et al. Standardisation of the single-breath determination of carbon monoxide uptake in the lung. Eur. Respir. J. 2005; 26: 720–35.
24 Miller MR, Hankinson J, Brusasco V, Burgos F, Casaburi R, Coates A, Crapo R, Enright P, van der Grinten CP, Gustafsson P et al. Standardisation of spirometry. Eur. Respir. J. 2005; 26: 319– 38.
25 Hankinson JL, Odencrantz JR, Fedan KB. Spirometric reference values from a sample of the general U.S. population. Am. J. Respir. Crit. Care Med. 1999; 159: 179–87.
26 Hankinson JL, Kawut SM, Shahar E, Smith LJ, Stukovsky KH, Barr RG. Performance of American Thoracic Society-recommended spirometry reference values in a multiethnic sample of adults: the multi-ethnic study of atherosclerosis (MESA) lung study. Chest 2010; 137: 138–45.
27 Japanese Respiratory Society. Standard values of spirometry and arterial blood gas analysis for Japanese. Journal of Japanese Respiratory Society 2001; 39.
28 Hu S, Hoffman EA, Reinhardt JM. Automatic lung segmentation for accurate quantitation of volumetric X-ray CT images. IEEE Trans. Med. Imaging 2001; 20: 490–8.
29 Tschirren J, Hoffman EA, McLennan G, Sonka M. Intrathoracic airway trees: segmentation and airway morphology analysis from low-dose CT scans. IEEE Trans. Med. Imaging 2005; 24: 1529–39.
30 Tschirren J, McLennan G, Palagyi K, Hoffman EA, Sonka M. Matching and anatomical labeling of human airway tree. IEEE Trans. Med. Imaging 2005; 24: 1540–7.
31 Gevenois PA, De Vuyst P, de Maertelaer V, Zanen J, Jacobovitz D, Cosio MG, Yernault JC. Comparison of computed density and microscopic morphometry in pulmonary emphysema. Am. J. Respir. Crit. Care Med. 1996; 154: 187–92.
32 Newell JD Jr, Hogg JC, Snider GL. Report of a workshop: quantitative computed tomography scanning in longitudinal studies of emphysema. Eur. Respir. J. 2004; 23: 769–75.
33 Peat J, Barton B. Continuous data analyses: correlation and regression. In: Peat J, Barton B (eds) Medical Statistics: a Guide to Data Analysis and Critical Appraisal, 1st edn. Blackwell Publishing Ltd, Oxford, UK, 2005; 156–201.
34 Tabachnick BG, Fidell LS. Multiple regression. In: Tabachnick BG, Fidell LS (eds) Using Multivariate Statistics, 5th edn. Pearson Education Inc., Boston, MA, 2006; 117–94.
35 Burney P. Coming off the GOLD standard. Lancet Respir. Med. 2014; 2: 174–6.
36 Martinez CH, Chen YH, Westgate PM, Liu LX, Murray S, Curtis JL, Make BJ, Kazerooni EA, Lynch DA, Marchetti N et al. Relationship between quantitative CT metrics and health status and
BODE in chronic obstructive pulmonary disease. Thorax 2012; 67: 399–406.
37 Smith BM, Hoffman EA, Rabinowitz D, Bleecker E, Christenson S, Couper D, Donohue KM, Han MK, Hansel NN, Kanner RE et al. Comparison of spatially matched airways reveals thinner airway
walls in COPD. The Multi-Ethnic Study of Atherosclerosis (MESA) COPD Study and the Subpopulations and Intermediate Out- comes in COPD Study (SPIROMICS). Thorax 2014; 69: 987–96.
38 Mohamed Hoesein FA, de Hoop B, Zanen P, Gietema H, Kruitwagen CL, van Ginneken B, Isgum I, Mol C, van Klaveren RJ, Dijkstra AE et al. CT-quantified emphysema in male heavy smokers: association with lung function decline. Thorax 2011; 66: 782–7.
39 Nishimura M, Makita H, Nagai K, Konno S, Nasuhara Y, Hasegawa M, Shimizu K, Betsuyaku T, Ito YM, Fuke S et al. Annual change in pulmonary function and clinical phenotype in chronic obstructive pulmonary disease. Am. J. Respir. Crit. Care Med. 2012; 185: 44–52.
40 Haruna A, Muro S, Nakano Y, Ohara T, Hoshino Y, Ogawa E, Hirai T, Niimi A, Nishimura K, Chin K et al. CT scan findings of emphysema predict mortality in COPD. Chest 2010; 138: 635–40.
41 Johannessen A, Skorge TD, Bottai M, Grydeland TB, Nilsen RM, Coxson H, Dirksen A, Omenaas E, Gulsvik A, Bakke P. Mortality by level of emphysema and airway wall thickness. Am. J. Respir.
Crit. Care Med. 2013; 187: 602–8.
42 Grydeland TB, Dirksen A, Coxson HO, Pillai SG, Sharma S, Eide GE, Gulsvik A, Bakke PS. Quantitative computed tomography: emphysema and airway wall thickness by sex, age and smoking.
Eur. Respir. J. 2009; 34: 858–65.
43 Kim EY, Seo JB, Lee HJ, Kim N, Lee E, Lee SM, Oh SY, Hwang HJ, Oh YM, Lee SD. Detailed analysis of the density change on chest CT of COPD using non-rigid registration of inspiration/ expiration CT scans. Eur. Radiol. 2015; 25: 541–9.
Supplementary Information
Additional Supplementary Information can be accessed via the html version of this article at the publisher’s web-site: Supplementary Figure S1 Measurement of emphysema and airway wall thickness using Apollo 1.2 software. Supplementary Table S1 Reasons for 30 patients in the Ho Chi Minh City cohort excluded from the study after undergoing CT scans.
Supplementary Table S2 Relative contributions of PD15 and Pi10 to predictions of FEV1/FVC by standard multiple regressions.
Supplementary Table S3 Relative contributions of PD15 and Pi10 to predictions of FEV1% predicted by standard multiple regressions.
Supplementary Appendix S1 More details about computed tomography evaluation and statistical analysis.