- Chi tiết
-
Được đăng: 03 Tháng 10 2015
Recent findings in chronic obstructive pulmonary disease by using quantitative computed tomography.
Abstract
Chronic obstructive pulmonary disease (COPD) is characterized by an incompletely reversible airflow limitation that results from a combination of airway wall remodeling and emphysematous lung destruction. Forced expiratory volume in 1 s (FEV1) has been considered the gold standard for diagnosis, classification, and follow-up in patients with COPD, but it has certain limitations and it is still necessary to find other noninvasive modalities to complement FEV1 to evaluate the effect of therapeutic interventions and the pathogenesis of COPD. Quantitative computed tomography (CT) has partly met this demand. The extent of emphysema and airway dimensions measured using quantitative CT are associated with morphological and functional changes and clinical symptoms in patients with COPD. Phenotyping COPD based on quantitative CT has facilitated interventional and genotypic studies. Recent advances in COPD findings with quantitative CT are discussed in this review.
1. Introduction
Chronic obstructive pulmonary disease (COPD) was estimated to have caused approximately 2.75 million deaths and 27.76 million disability-adjusted life years worldwide in 2002 [1]. COPD is expected to be the third leading cause of death and the fifth leading cause of morbidity in the world by the year 2020 [2]. The pulmonary component of COPD is characterized by airflow limitation that is not fully reversible [3]. Airflow limitation is defined by pulmonary function test results and is caused by narrowing of small airways [4,5], which is a consequence of a combination of airway wall thickening due to airway wall remodeling and loss of tethering force due to emphysematous lung destruction [6]. To fully evaluate these morphological abnormalities in patients with COPD, lung specimens are needed. However, lung biopsy is not a feasible option for most patients who participate in cross-sectional or longitudinal studies [7]. With advances in computed tomography (CT) technology combined with visual scoring systems or CT image analysis programs, i.e., computer algorithms that can be used to analyze CT data, herein referred to as quantitative CT, these morphological changes can now be analyzed in detail in a relatively non-invasive manner. Quantitative CT in COPD has been used to evaluate severity of emphysema, and to assess airway dimensions and small pulmonary vessels on CT images. These methods allow for comparison of CT abnormalities between patients or observation of progression of disease within a single patient. Recent findings in COPD using quantitative CT are discussed in this review.
2. Extent of emphysema
Emphysema is characterized by permanently enlarged air-spaces distal to the terminal bronchiole with destruction of the alveolar wall [8,9]. It is generally classified as centrilobular, panlobular, or paraseptal [10,11]. The CT appearance of emphysema features low attenuation areas (LAAs) [12,13]. In order to quantify severity, the percentage of low attenuation areas (LAA%), which implies the extent of emphysema, is calculated. The LAA% of each CT section is the ratio of the LAAs to the total lung area multiplied by 100 [14].
Initially, the extent of emphysema visualized was quantified as an emphysema score. The emphysema score of a section is 0 if its LAA% is o5%, 1 from 5% to o25%, 2 from 25% to o50%, 3 from 50% to o75%, and 4 if Z75% [15]. However, this method is time-consuming and generates intra-observer and inter-observer errors [16]. Now, CT image analysis programs have been developed to segment the lung parenchyma and measure lung density on CT images. The extent of emphysema quantified using these programs is based on threshold cut-off methods, also known as density mask [14,17–19] or percentile point methods [20–25]. The ‘‘density mask’’ method is used more often. This method uses overlay masks to distinguish the location and size of emphysematous lesions on the CT images (Fig. 1). With this method, LAA is defined as the total number of pixels (for 2-dimensional images) or voxels (for 3-dimensional images) that demonstrate lung attenuation below a certain threshold [19] that is predetermined in accordance with lung volume at scanning, slice thickness, and reconstruction algorithms and can range from À856 HU to À960 HU [14,17–19]. LAA% quantified by these methods correlates well with the extent of emphysema quantified by visual scoring systems [19,26] and macroscopic [16,17,19,25] and microscopic measurements [18,25]. Because LAA% is affected by CT machine calibration [27], lung volume at scanning [24,28–30], reconstruction slice thickness [22], and reconstruction algorithm [31], these factors should be controlled for valid results in longitudinal studies.
LAA% quantified on CT scans at full inspiration is associated with forced expiratory volume in 1 s (FEV1), ratio of FEV1 to forced vital capacity (FEV1/FVC), residual volume (RV), diffusing capacity of the lung for carbon monoxide (DLCO), and ratio of DLCO to alveolar volume (DLCO/VA) [32–37]. These relationships reflect the contribution of emphysema to airflow limitation and reduced diffusing capacity in COPD. LAA% can be estimated from a model that includes FEV1 and DLCO/VA [34,35]. Some investigators have also shown that LAA% quantified at full expiration correlated more closely with pulmonary function tests, especially with RV/total lung capacity (TLC), which reflects air trapping in COPD, than LAA% quantified at full inspiration [32,38–42]. They argue that LAA% quantified at full expiration reflects both air trapping and emphysema in COPD. Nonetheless, because lung CT scans are generally performed at full inspiration in routine practice, in most ongoing studies, LAA% is still quantified at full inspiration rather than at full expiration.
Clinically, LAA% is higher in males than in females [43,44], and it increases with increasing age and number of pack- years of smoking [44]. LAA% correlates negatively with body mass index (BMI) [45–47] and positively with degree of dyspnea [33]. Furthermore, LAA% complements FEV1 in explaining the severity of dyspnea [48].
Emphysema quantification has been applied to longitudinal studies as well as cross-sectional studies. In 144 patients with COPD who were followed for 30 months, detection of emphysema progression was found to be 2.5-fold more sensitive with lung densitometry than by FEV1 or gas diffusion [49]. In another study, 60 patients with COPD were prospectively monitored for exacerbations for 2 years. The annual increase in LAA% was significantly greater in patients with exacerbations than in patients without exacerbations (Po0.0001), while there was no difference in the FEV1% decline between the 2 groups (P1⁄4 0.40) [50]. A greater extent of emphysema at baseline CT scanning was associated with higher rates of lung function decline in obstructed and non- obstructed smokers after 3 years of follow up. The extent of emphysema at baseline CT scanning also helped to identify non-obstructed smokers who were predicted to develop air- flow obstructions [51].
Emphysema assessment by quantitative CT is a good predictor of mortality in COPD patients. A higher LAA% has been associated with increased mortality from respiratory diseases [52]. In addition, emphysema can be a predictor of comorbidity in patients with COPD. LAA% has been correlated with bone mineral density of the thoracic vertebrae as measured by CT densitometry [53]. The presence of visual or quantitative emphysema is associated with osteoporosis of the lumbar and hip bones detected by dual-energy X-ray absorptiometry [54]. The presence of emphysema assessed using a visual scoring system is also associated with lung cancer in smokers. This association remains significant after adjusting for age, sex, smoking history, and level of airflow limitation [55–57]. Emphysema severity is also associated with arterial stiffness, a marker of cardiovascular risk. This association is independent of age, sex, smoking history, airflow limitation, or systemic inflammation [58,59].
The extent of emphysema is quantified for the whole lung and for lung regions such as core (inner) versus rind (outer) regions [37,60], upper versus lower regions [60], or even for each lobe within the lung [61]. This application of quantitative CT helps in selecting candidates for lung volume reduction surgery (LVRS) and provides insights into the mechanisms of improvement after LVRS. In a subgroup of 21 patients with severe COPD who underwent LVRS, post- operative changes in FEV1 and maximal exercise capacity correlated with extent of preoperative emphysema of the whole lung [60,62,63] and the upper [62], and upper-rind regions of the lungs [60]. The volume reduction in regions with severe emphysema [63] or with confluent emphysema [62] has been cited as a mechanism of improvement after LVRS. However, with multiple regression analysis, only the extent of emphysema of the upper-rind region of the lungs was a significant predictor for improvement of pulmonary function after LVRS [60]. This result was repeated in a recent study with 546 patients [64]. However, the magnitude of these correlations was very small (R2 1⁄4 0.15 for prediction of FEV1 change and R2 1⁄40.16 for prediction of maximal capacity change), which has raised concerns about the clinical application of the result.
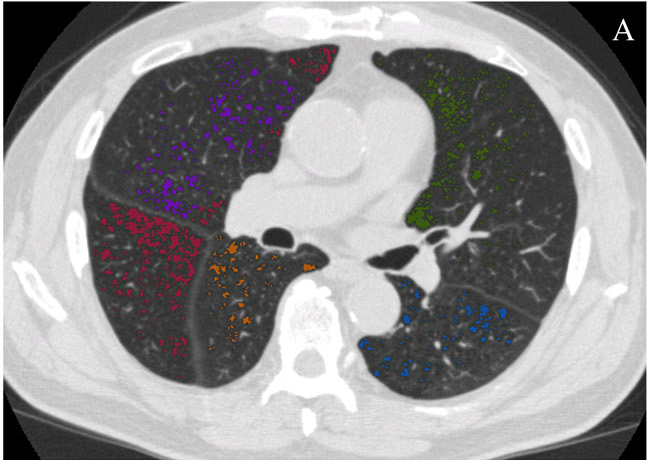
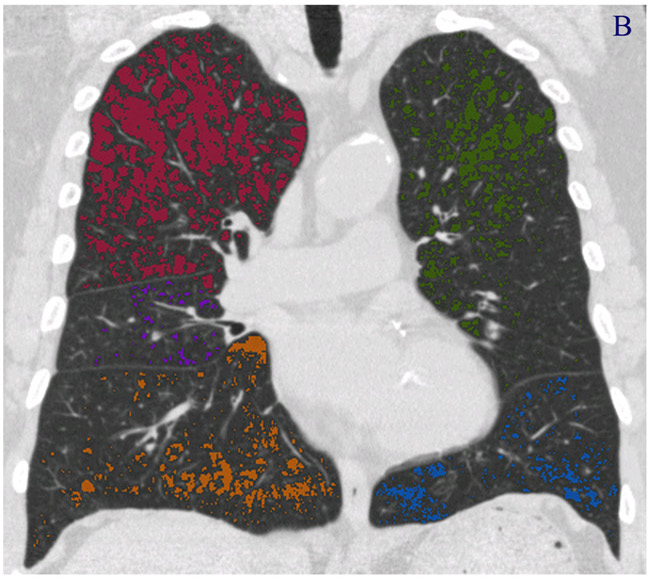
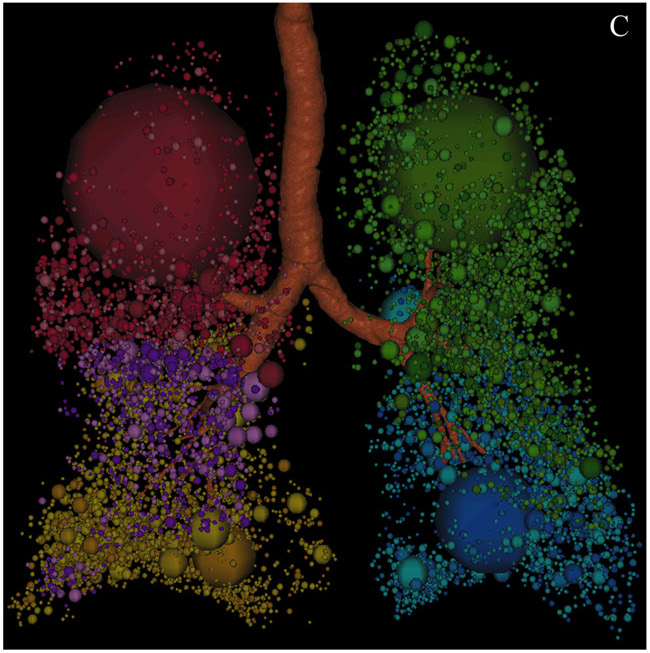
Fig. 1 – Quantification of emphysema using the density mask method. Emphysematous lesions are masked with different colors depending on the pulmonary lobes (red for right upper lobe, purple for right middle lobe, dark yellow for right lower lobe, green for left upper lobe, and blue for left lower lobe). (A) Axial section image. (B) Coronal section image. (C) Three- dimensional image, with the spheres representing the sizes of the emphysematous lesions. These images were obtained from a 79-year-old male patient with stage III COPD using Pulmonary Workstation 2.0 (VIDA Diagnostics, IA, USA) and reconstructed with 1-mm slice thickness and a standard algorithm. The threshold cut-off for emphysema was À950 HU. The percentage of low attenuation area (LAA%) in this patient was 15%.
Besides the values of quantitative CT for patients with COPD, we should also be aware of the risk of radiation exposure. Because of the concern that repeated CT scans over time may be associated with consequent cancer risk [65], several investigators have proposed low-dose CT scans (30–60 mA s) as an alternative to standard-dose CT scans (100–250 mA s) in the quantification of emphysema. They found that even though the mean noise level was greater with low-dose than with standard-dose CT, there was a good correlation of LAA% between the 2 protocols [66,67]. At most thresholds of emphysema, the LAA% was greater on low-dose than on standard-dose scans [22,66], but the difference might not be clinically important [66]. However, because the effect of radiation dose on LAA% varies depending on lung volume [68] and slice thickness [22], these 2 factors should be taken into account when comparing LAA% between scans with different radiation doses.
In summary, the extent of emphysema as determined by quantitative CT correlates with macroscopic and microscopic measurements of emphysema, pulmonary function tests, and clinical symptoms. Emphysema evaluation using quantitative CT has been applied for selecting candidates for LVRS or for phenotyping COPD patients for ongoing studies, which we will discuss in the final section of this review.
3. Quantification of airway dimensions
Quantification of airway dimensions in COPD is used to evaluate airway wall thickening and lumen narrowing. The severity of these histologic changes correlates with the severity of COPD evaluated according to the Global Initiative for Chronic Obstructive Lung Disease (GOLD) [4]. Therefore, several CT image analysis programs have been developed to measure airway internal area (Ai) and airway wall area (Aaw) on CT images. Further indexes of airway dimensions including airway outer area (Ao) (Ao1⁄4AiþAaw) and the percentage of wall area (WA%) [WA%1⁄4 (Aaw/Ao) Â 100] can also be derived from these measurements. The algorithm for detecting airway lumen is based on the density mask method, and threshold values for airway lumen vary from À500 HU to À577 HU [69]. Algorithms for detecting the inner and outer margins of airway walls are based on different methods including full-width at half-maximum [36,70], maximum- likelihood [71], score-guided erosion [69], Laplacian of Gaussian [72], and fitting ellipses [73]. These programs have been validated in phantom studies and in excised pig, sheep, and human lungs by micrometer measurements and manual estimation [69,72–74]. Initially, these programs were limited to quantifying the dimensions of airways with ratios of longest-to-shortest diameters of less than 2.0 on 2-dimensional CT images [36,72,75,76]. This limitation was intended to avoid underestimating Ai and overestimating Aaw, especially for small airways [69,71]. However, it reduces the count of measurable airways on each CT image or the whole lung [73]. Since the advent of multi-slice CT scanners and volumetric CT scanning methods, the bronchial tree can now be reconstructed using 3-dimensional CT analysis programs. These programs can be applied to measure the airway dimensions of nearly all visible airways at specific locations, even those that are not oriented perpendicularly to the axial plane (Fig. 2) [73,74,77–80].
Initially, due to limitations of CT resolution and analysis programs [36,81,82], only segmental bronchi (third generation) were evaluated. Presently, bronchi up to the 6th generation have been measured in patients with COPD using CT analysis programs [74,77,78]. Even though these measured locations are not at the site of obstruction in COPD [4], the correlation between airway wall areas of relatively large airways measured by CT and those of small airways measured by histology analysis has justified these evaluations in COPD [75]. The strong correlation of airway dimensions obtained using CT and optical coherent tomography further supports the usefulness of quantitative CT in the determination of airway dimensions [83]. However, to date, no consensus has been reached about locations and counts of measurable airways for quantification of airway dimensions in COPD. Some investigators evaluate only the apical bronchus of the right upper lobe [36] because airway dimensions at this location correlate with those at the basal bronchus of the right lower lobe [82], and both are perpendicular to axial CT sections. However, because the WA% of the anterior basal segmental bronchus of the right lower lobe correlates with FEV1 more closely than that of the apical segmental bronchus of the right upper lobe [77], others have measured representative bronchi for each lobe [70,81,84,85], or even as many bronchi as possible [76,78,86,87]. When measuring airway dimensions at different locations along each bronchus and/or along different bronchi, the mean or median of all these measurements is estimated to provide values for each subject [76,78,86]. However, this method neglects the heterogeneity of airway dimensions between generations along each bronchus [70,77,88] or between different lobes in patients with COPD. To solve this problem and to generate comparable results in cross-sectional or longitudinal studies, the square root of the wall area of a hypothetical airway with an internal perimeter of 10 mm (OAaw at Pi10) has emerged (Fig. 3) [75]. This index of airway dimensions correlates with pulmonary function tests and clinical symptoms [48,81,87].
WA%, Ai, and OAaw at Pi10 are common indexes of airway dimensions, and have been used in many studies relating to COPD. WA% and OAaw at Pi10 represent airway wall thickening or remodeling. Ai represents lumen narrowing due to airway wall thickening, luminal inflammatory exudates, and/ or loss of parenchymal tethering in patients with COPD. WA% [36,70,77,86], Ai [70,77,84], and OAaw at Pi10 [87] have all been correlated with FEV1. The correlation coefficients of WA% or Ai with FEV1 increase as the bronchial size decreases from the third to the sixth generation of bronchi [70,77,84].
In addition to the parameters of pulmonary function tests, airway dimensions also correlate with clinical symptoms in patients with COPD. Patients with symptoms of chronic bronchitis are more likely to have higher WA% or OAaw at Pi10 than patients without these symptoms [48,76,81]. WA% in patients with COPD is lower than that in patients with asthma [85], but higher than that in healthy smokers [36] and non-smokers [86]. OAaw at Pi10 decreases with increasing age, increases with increasing number of pack-years of smoking, and is higher in males than in females, even after adjusting for FEV1 [44].
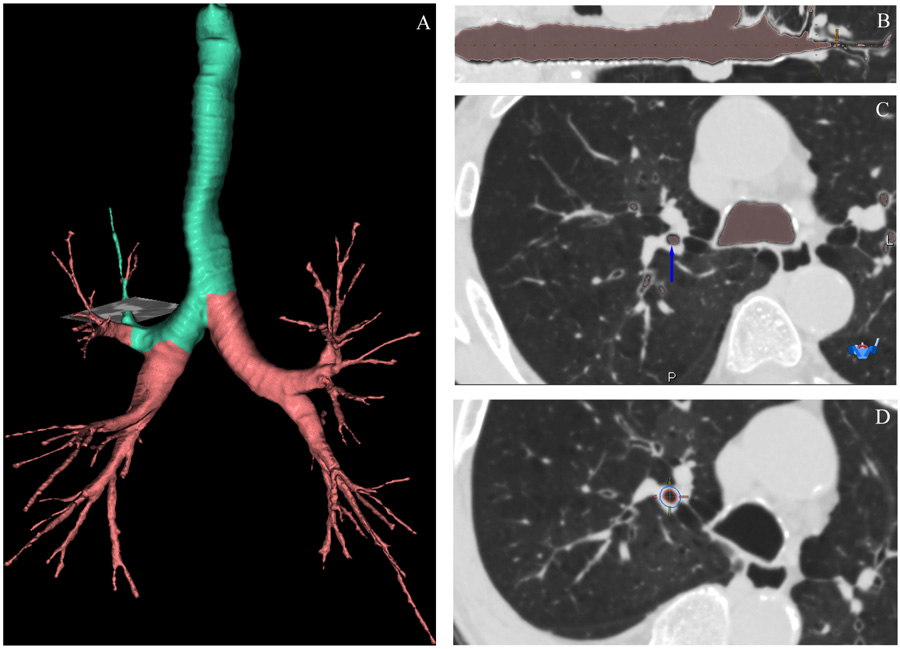
Fig. 2 – Quantification of airway dimensions using a 3-dimensional CT analysis program. (A) The bronchial tree and the pathway of the target airway (in green color) with the location of measurement (gray horizontal plane). (B) Curved multi-planar reconstruction image of the target airway and the location of measurement (vertical dashed yellow line). (C) An axial section with airway lumen is masked in pink and the blue arrow indicates the measured bronchus. (D) The inner and outer margins of the measured bronchus are marked as red and blue circles, respectively. These images were obtained from a 75-year-old male patient with stage IV COPD using Apollo 1.1 (VIDA Diagnostics, IA, USA).
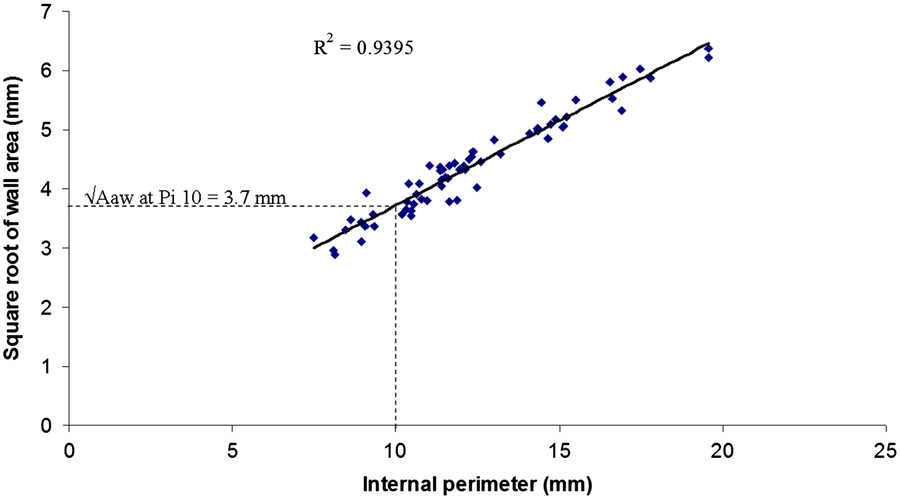
Fig. 3 – Estimation of OAwa at Pi10. The square root of the wall area of the measured segment is plotted against its internal perimeter. The square root of the wall area of the hypothetical airway with an internal perimeter of 10 mm (OAwa at Pi10) is calculated from the linear regression equation. This figure shows the OAwa at Pi10 of the patient in Fig. 2 calculated from all measured bronchial segments with internal perimeters ranging from 6 to 20 mm. The OAwa at Pi10 was 3.7 mm and the R2 value of the linear regression equation was 0.94.
Very few longitudinal studies have reported quantification of airway dimensions. In one study, during 4 years of follow-up of 38 patients with COPD, annual changes in WA% were inversely correlated with annual changes in FEV1 (r1⁄4 À0.363, P1⁄40.025) [89]. More findings relating to this aspect of airway dimensions are expected when results of the Evaluation of COPD Long- itudinally to Identify Predictive Surrogate End-points (ECLIPSE) [90] and other longitudinal studies are reported in the near future. Regarding changes in airway dimensions in response to specific treatment, the relationship of changes between Ai and FEV1 in response to a 7-day course of tiotropium bromide inhalation in 15 patients with COPD was investigated. The mean percentage Ai increase was correlated with percent FEV1 increase (r1⁄4 0.843, Po0.001). Such correlations were sig- nificant for the fourth to sixth generation bronchi, but not among the third generation bronchi [91].
In summary, WA% and OAaw at Pi10 are useful investigative parameters because they reflect airway wall remodeling and are associated with levels of airflow limitation and clinical symptoms in patients with COPD. However, further studies are still needed to standardize measurements and clarify the implications of quantification of airway dimensions in COPD.
4. Quantification of small pulmonary vessels
In addition to evaluation of emphysema and airway dimensions, quantitative CT is applied to quantify small pulmonary vessels in COPD. Matsuoka et al. used a semi-automated CT analysis program to segment pulmonary vessels on 2-dimensional CT scans [92–94]. The total cross-sectional area of small pulmonary vessels (CSA), including subsegmental vessels (those with cross-sectional area from 5 to 10 mm2, CSA5–10) and subsegmental vessels (those with cross-sectional area less 5 mm2, CSAo5), was calculated from selected CT images. The percentage of total CSA to the corresponding lung area (%CSA5–10, %CSAo5, respectively) was generated and correlated other indices. In smokers, %CSAo5 was significantly correlated with LAA% (r1⁄4 À0.83, Po0.0001), FEV1% predicted (r1⁄4 0.29, Po0.0001), and FEV1/FVC (r1⁄40.45, Po0.0001) [92]. In patients with COPD, %CSAo5 was negatively correlated with pulmonary arterial mean pressure [93] and thoracic aorta calcification score [94]. These findings implied that a reduction in CSA is associated with increased degrees of emphysema, pulmonary hypertension, and atherosclerosis in COPD.
Contrary to %CSAo5, there was no significant correlation or only a weak correlation between %CSA5–10 and the other aforementioned indices in COPD. This finding supports the notion that alterations in pulmonary vasculature may occur predominantly in peripheral vessels [92–94].
Evaluation of small pulmonary vessels using quantitative CT currently has the following limitations: firstly, small pulmonary arteries and veins are not evaluated separately. Secondly, CSA measurements are affected by several factors, including cardiac cycle, respiratory cycle, and scanning protocol. Thirdly, thus far, there are no standard CT scanning protocols or fully-automated CT image analysis programs that have been validated to accurately quantify small pulmonary vessels. In summary, evaluation of small pulmonary vessels using quantitative CT can reflect pulmonary vascular changes in COPD patients, but research is still needed in order to certify the utility of quantitative CT as a non-invasive tool for assessing pulmonary arterial hypertension and other morphological changes in small pulmonary vessels in patients with COPD.
5. COPD phenotypes
The GOLD guidelines for the diagnosis and management of COPD are mainly based on FEV1% predicted and are useful to classify disease severity and choose a corresponding treatment regimen [3]. However, even within the same GOLD stage, patients with COPD will present with different clinical subtypes depending on BMI, severity of dyspnea, frequency of acute exacerbations, and response to inhaled corticosteroids (ICS) or bronchodilators [95–97]. With each subtype, it is important to choose an appropriate regimen in order to optimize the cost-effectiveness of the chosen treatment. If there is no means other than FEV1 for classifying patients with COPD into specific groups in longitudinal studies, the effects of certain treatments may not be proved in terms of primary outcomes [98]. Phenotyping COPD patients based on quantitative CT findings has partly addressed this concern.
5.1. Airway remodeling-dominant versus emphysema dominant phenotypes
Patients with COPD can be divided into 3 groups on the basis of WA% and LAA%: an airway remodeling-dominant group (high WA% and low LAA%), an emphysema-dominant group (low WA% and high LAA%), and a mixed group (high WA% and high LAA%) (Fig. 4) [99]. From this point of view, several investigators have tried to phenotype COPD according to quantitative CT in order to relate these phenotypes to clinical symptoms and pulmonary function tests. Patients with symptoms of chronic bronchitis had lower LAA% and higher WA% than patients without symptoms [76]. Meanwhile, patients with the airway remodeling-dominant phenotype had significantly higher BMI, increased wheezing, and better response to bronchodilators or ICS than those with the emphysema-dominant or mixed phenotype [96,97]. Patients with the emphysema-dominant phenotype showed minimal reversibility in response to treatment with bronchodilators or ICS [96,97,100,101]. It is possible that phenotyping COPD based on quantitative CT analysis may open new avenues of pharmaceutical research for COPD, possibly facilitating development of drugs that target the airway wall remodeling process or the alveolar destruction process [102]. This method also helps to classify patients with COPD into appropriate subgroups for interventional trials, and should complement pulmonary function tests in objective evaluation of outcomes for those trials while recognizing potential benefits of specific regimens tailored to the subgroups.
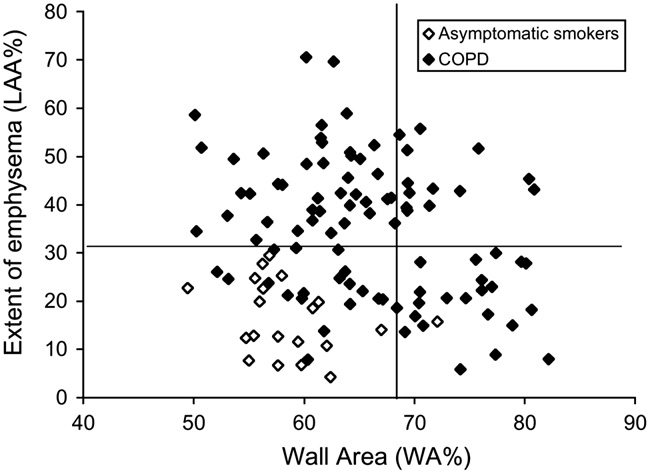
Fig. 4 – Phenotypes of COPD based on quantitative CT. Relationship between percentage of wall area (WA%) and percentage of low attenuation area (LAA%) in 94 patients with COPD and 20 asymptomatic smokers. The horizontal line represents the mean þ2SD of LAA% of the asymptomatic smokers. The vertical line indicates the mean þ2SD of WA% of the asymptomatic smokers. Using these cut-off values, patients with COPD can be divided into 3 groups: an airway remodeling-dominant group (high WA% and low LAA%), an emphysema-dominant group (low WA% and high LAA%), and a mixed group (high WA% and high LAA%). Adapted from Nakano et al. [99].
5.2. Phenotypes of COPD based on quantitative CT for genotypic studies
The genetic component plays a significant role in the pathogenesis of COPD, which explains why only 15–20% of smokers develop COPD and why COPD patients of varying ethnicities, genders, and risk factors have different clinical phenotypes [3]. Determining which genes are responsible for predisposition to COPD or which genes determine specific phenotypes might prove crucial for rigorous prevention, early detection, and potential cure.
Reproducible COPD phenotypes defined by quantitative CT can facilitate investigations of genotypes because of the similar pathogenic mechanisms represented by each phenotype. The role of genetic control in developing COPD was highlighted in a study of 519 probands and 640 siblings. The results showed that emphysema was more prevalent in the siblings of probands with significant emphysema than in the siblings of probands without emphysema. OAaw at Pi10 in the siblings was significantly correlated with those of the probands [87].
Genetic predisposition to emphysema has been investigated in several studies. A group-specific component of serum globulin (Gc-globulin) polymorphism has been significantly associated with susceptibility to COPD and with the severity of emphysema in a Japanese population [103]. By using a genome-wide association study (GWAS) method to identify genetic determinants of emphysema in Caucasian patients with COPD investigators identified BICD1 [104] and CHRNA3/5 [105] as novel genes for emphysema susceptibility in COPD. Matrix Metalloproteinase-9 (MMP-9) polymorphism was also thought to be related to emphysema, but ultimately this was not proven [106,107] although it was associated with upper lung-dominant emphysema in Japanese patients with COPD [107]. Apical-predominant emphysema also appeared to be influenced by various genes including GSTP1, EPHX1, and certain MMP1 polymorphisms of xenobiotic metabolizing enzymes in Caucasians with COPD [108], and other genes have been associated with protective mechanisms against emphysema. For example, Japanese patients with COPD who had the À28G allele of the CCL5 gene had findings associated with milder emphysema [109]. For Caucasian populations, smokers with a less active form of MMP-12 may be partly protected from severe emphysema [110].
Because there is no optimal method of quantifying airway dimensions yet, there have been very few studies investigating genotypes of the COPD patients with airway remodeling- dominant phenotypes. One study in 111 patients with COPD in a South Korean population measured airway dimensions near the origins of the right apical segmental bronchus and the left apical-posterior segmental bronchus, and investigators found that the ADRB2 genotype with a G allele was associated with the airway remodeling-dominant phenotype [111]. Another study was conducted to identify the association between 3 loci (HHIP, FAM13A, CHRNA3/5) and COPD phenotypes in 1609 Caucasian patients with COPD. Airway wall thickness measurements (OAawa at Pi10 and WA%) were not associated with any of these single nucleotide polymorphisms [105].
In summary, the utility of phenotyping COPD patients for further interventional and genotypic studies has become more apparent. Reproducible phenotypes of COPD based on quantitative CT have partly met the demand.
6. Conclusions
CT technology and CT image analysis programs have improved over time so that quantitative CT studies for COPD patients are less time-consuming, more convenient, and more reproducible. These improvements have led to new findings related to extent of emphysema, airway dimensions, and condition of the small pulmonary vessels that have been described in recent years. Phenotyping of COPD based on quantitative CT has facilitated interventional and genotypic studies. Minimizing radiation exposure, controlling the uniformity of CT scanning parameters, and standardizing the quantification of airway dimensions and small pulmonary vessels should be considered. More studies are needed to address the current limitations of quantitative CT. We anticipate that quantitative CT for COPD will be useful not only in research, but also in routine clinical practice.
Conflict of interest
Division of Respiratory Medicine, Department of Medicine, Shiga University of Medical Science received a research Grant from Otsuka Pharmaceutical Co., Ltd. Yasutaka Nakano received lecture fees from Nippon Boehringer Ingelheim Co., Ltd. Nguyen Van Tho, Hiroshi Wada, Emiko Ogawa, they have no potential conflict of interest.
Nguyen Van Thoa,c,1, Hiroshi Wadaa, Emiko Ogawaa,b, Yasutaka Nakano a,n
a Division of Respiratory Medicine, Department of Medicine, Shiga University of Medical Science, Seta Tsukinowacho, Otsu, Shiga 520-2192, Japan
b Health Administration Center, Shiga University of Medical Science, Shiga, Japan
c Respiratory Care Unit, University Medical Center, University of Medicine and Pharmacy in Ho Chi Minh City, Vietnam
References
[1] World Health Organization. The World health report 2004—changing history. Geneva: World Health Organization; 2004 Available at: /http://www.who.int/whr/2004/en/S [accessed 28.03.12].
[2] Murray CJ, Lopez AD. Alternative projections of mortality and disability by cause 1990–2020: global burden of disease study. Lancet 1997;349:1498–504.
[3] The Global Strategy for the Diagnosis. Management, and prevention of COPD. Global Initiative for Chronic Obstructive Lung Disease (GOLD); 2011 Available at: /http://www.gold copd.orgS [accessed 28.03.012]..
[4] Hogg JC, Chu F, Utokaparch S, et al. The nature of small- airway obstruction in chronic obstructive pulmonary disease. N Engl J Med 2004;350:2645–53.
[5] Hogg JC, Macklem PT, Thurlbeck WM. Site and nature of airway obstruction in chronic obstructive lung disease. N Engl J Med 1968;278:1355–60.
[6] Hogg JC. Pathophysiology of airflow limitation in chronic obstructive pulmonary disease. Lancet 2004;364:709–21.
[7] Coxson HO, Rogers RM. Quantitative computed tomography of chronic obstructive pulmonary disease. Acad Radiol 2005;12:1457–63.
[8] The definition of emphysema. Report of a National Heart, Lung, and Blood Institute, Division of Lung Diseases Workshop. Am Rev Respir Dis 1985;132:182–5.
[9] Thurlbeck WM, Muller NL. Emphysema: definition, imaging, and quantification. AJR Am J Roentgenol 1994;163:1017–25.
[10] Bergin CJ, Muller NL, Miller RR. CT in the qualitative assessment of emphysema. J Thorac Imaging 1986;1:94–103.
[11] Hansell DM, Bankier AA, MacMahon H, et al. Fleischner Society: glossary of terms for thoracic imaging. Radiology 2008;246:697–722.
[12] Bergin C, Muller N, Nichols DM, et al. The diagnosis of emphysema. A computed tomographic–pathologic correlation. Am Rev Respir Dis 1986;133:541–6.
[13] Foster Jr. WL, Pratt PC, Roggli VL, et al. Centrilobular emphysema: CT–pathologic correlation. Radiology 1986;159:27–32.
[14] Sakai N, Mishima M, Nishimura K, et al. An automated method to assess the distribution of low attenuation areas on chest CT scans in chronic pulmonary emphysema patients. Chest 1994;106:1319–25.
[15] Goddard PR, Nicholson EM, Laszlo G, et al. Computed tomography in pulmonary emphysema. Clin Radiol 1982;33:379–87.
[16] Bankier AA, De Maertelaer V, Keyzer C, et al. Pulmonary emphysema: subjective visual grading versus objective quantification with macroscopic morphometry and thin- section CT densitometry. Radiology 1999;211:851–8.
[17] Gevenois PA, de Maertelaer V, De Vuyst P, et al. Comparison of computed density and macroscopic morphometry in pulmonary emphysema. Am J Respir Crit Care Med 1995;152:653–7.
[18] Gevenois PA, De Vuyst P, de Maertelaer V, et al. Comparison of computed density and microscopic morphometry in pulmonary emphysema. Am J Respir Crit Care Med 1996;154:187–92.
[19] Muller NL, Staples CA, Miller RR, et al. Density mask. An objective method to quantitate emphysema using computed tomography. Chest 1988;94:782–7.
[20] Dirksen A, Dijkman JH, Madsen F, et al. A randomized clinical trial of alpha(1)-antitrypsin augmentation therapy. Am J Respir Crit Care Med 1999;160:1468–72.
[21] Gould GA, MacNee W, McLean A, et al. CT measurements of lung density in life can quantitate distal airspace enlargement—an essential defining feature of human emphysema. Am Rev Respir Dis 1988;137:380–92.
[22] Madani A, De Maertelaer V, Zanen J, et al. Pulmonary emphysema: radiation dose and section thickness at multi- detector CT quantification—comparison with macroscopic and microscopic morphometry. Radiology 2007;243:250–7.
[23] Madani A, Van Muylem A, de Maertelaer V, et al. Pulmonary emphysema: size distribution of emphysematous spaces on multidetector CT images—comparison with macroscopic and microscopic morphometry. Radiology 2008;248:1036–41.
[24] Madani A, Van Muylem A, Gevenois PA. Pulmonary emphysema: effect of lung volume on objective quantification at thin-section CT. Radiology 2010;257:260–8.
[25] Madani A, Zanen J, de Maertelaer V, et al. Pulmonary emphysema: objective quantification at multi-detector row CT—comparison with macroscopic and microscopic morphometry. Radiology 2006;238:1036–43.
[26] Gietema HA, Muller NL, Fauerbach PV, et al. Quantifying the extent of emphysema: factors associated with radiologists’ estimations and quantitative indices of emphysema severity using the ECLIPSE cohort. Acad Radiol 2011;18:661–71.
[27] Parr DG, Stoel BC, Stolk J, et al. Influence of calibration on densitometric studies of emphysema progression using computed tomography. Am J Respir Crit Care Med 2004;170:883–90.
[28] Moroni C, Mascalchi M, Camiciottoli G, et al. Comparison of spirometric-gated and -ungated HRCT in COPD. J Comput Assist Tomogr 2003;27:375–9.
[29] Orlandi I, Moroni C, Camiciottoli G, et al. Spirometric-gated computed tomography quantitative evaluation of lung emphysema in chronic obstructive pulmonary disease: a comparison of 3 techniques. J Comput Assist Tomogr 2004;28:437–42.
[30] Stoel BC, Putter H, Bakker ME, et al. Volume correction in computed tomography densitometry for follow-up studies on pulmonary emphysema. Proc Am Thorac Soc 2008;5:919–24. Boedeker KL, McNitt-Gray MF, Rogers SR, et al. Emphysema: effect of reconstruction algorithm on CT imaging measures. Radiology 2004;232:295–301.
[31] Akira M, Toyokawa K, Inoue Y, et al. Quantitative CT in chronic obstructive pulmonary disease: inspiratory and expiratory assessment. AJR Am J Roentgenol 2009;192:267–72.
[32] Camiciottoli G, Bartolucci M, Maluccio NM, et al. Spirome- trically gated high-resolution CT findings in COPD: lung attenuation vs lung function and dyspnea severity. Chest 2006;129:558–64.
[33] Cerveri I, Dore R, Corsico A, et al. Assessment of emphysema in COPD: a functional and radiologic study. Chest 2004;125:1714–18.
[34] Desai SR, Hansell DM, Walker A, et al. Quantification of emphysema: a composite physiologic index derived from CT estimation of disease extent. Eur Radiol 2007;17:911–18.
[35] Nakano Y, Muro S, Sakai H, et al. Computed tomographic measurements of airway dimensions and emphysema in smokers. Correlation with lung function. Am J Respir Crit Care Med 2000;162:1102–8.
[36] Nakano Y, Sakai H, Muro S, et al. Comparison of low attenuation areas on computed tomographic scans between inner and outer segments of the lung in patients with chronic obstructive pulmonary disease: incidence and contribution to lung function. Thorax 1999;54:384–9.
[37] Eda S, Kubo K, Fujimoto K, et al. The relations between expiratory chest CT using helical CT and pulmonary function tests in emphysema. Am J Respir Crit Care Med 1997;155:1290–4.
[38] Kauczor HU, Hast J, Heussel CP, et al. CT attenuation of paired HRCT scans obtained at full inspiratory/expiratory position: comparison with pulmonary function tests. Eur Radiol 2002;12:2757–63.
[38] Matsuoka S, Kurihara Y, Yagihashi K, et al. Quantitative assessment of peripheral airway obstruction on paired expiratory/inspiratory thin-section computed tomography in chronic obstructive pulmonary disease with emphysema. J Comput Assist Tomogr 2007;31:384–9.
[39] Yamashiro T, Matsuoka S, Bartholmai BJ, et al. Collapsibility of lung volume by paired inspiratory and expiratory CT scans: correlations with lung function and mean lung density. Acad Radiol 2010;17:489–95.
[40] Zaporozhan J, Ley S, Eberhardt R, et al. Paired inspiratory/ expiratory volumetric thin-slice CT scan for emphysema analysis: comparison of different quantitative evaluations and pulmonary function test. Chest 2005;128:3212–20.
[40] Dransfield MT, Washko GR, Foreman MG, et al. Gender differences in the severity of CT emphysema in COPD. Chest 2007;132:464–70.
[41]Grydeland TB, Dirksen A, Coxson HO, et al. Quantitative computed tomography: emphysema and airway wall thickness by sex, age and smoking. Eur Respir J 2009;34:858–65.
[42]Zaporozhan J, Ley S, Eberhardt R, et al. Paired inspiratory/ expiratory volumetric thin-slice CT scan for emphysema analysis: comparison of different quantitative evaluations and pulmonary function test. Chest 2005;128:3212–20.
[43]Dransfield MT, Washko GR, Foreman MG, et al. Gender differences in the severity of CT emphysema in COPD. Chest 2007;132:464–70.
[44] Grydeland TB, Dirksen A, Coxson HO, et al. Quantitative computed tomography: emphysema and airway wall thickness by sex, age and smoking. Eur Respir J 2009;34:858–65.
[45] Lee YK, Oh YM, Lee JH, et al. Quantitative assessment of emphysema, air trapping, and airway thickening on computed tomography. Lung 2008;186:157–65.
[46] Makita H, Nasuhara Y, Nagai K, et al. Characterisation of phenotypes based on severity of emphysema in chronic obstructive pulmonary disease. Thorax 2007;62:932–7.
[47] Ogawa E, Nakano Y, Ohara T, et al. Body mass index in male patients with COPD: correlation with low attenuation areas on CT. Thorax 2009;64:20–5.
[48] Grydeland TB, Dirksen A, Coxson HO, et al. Quantitative computed tomography measures of emphysema and airway wall thickness are related to respiratory symptoms. Am J Respir Crit Care Med 2010;181:353–9.
[49] Stolk J, Putter H, Bakker EM, et al. Progression parameters for emphysema: a clinical investigation. Respir Med 2007;101: 1924–30.
[50] Tanabe N, Muro S, Hirai T, et al. Impact of exacerbations on emphysema progression in chronic obstructive pulmonary disease. Am J Respir Crit Care Med 2011;183:1653–9.
[51] Mohamed Hoesein FA, de Hoop B, Zanen P, et al. CT- quantified emphysema in male heavy smokers: association with lung function decline. Thorax 2011;66:782–7.
[52] Haruna A, Muro S, Nakano Y, et al. CT scan findings of emphysema predict mortality in COPD. Chest 2010;138: 635–40.
[53] Ohara T, Hirai T, Muro S, et al. Relationship between pulmonary emphysema and osteoporosis assessed by CT in patients with COPD. Chest 2008;134:1244–9.
[54] Bon J, Fuhrman CR, Weissfeld JL, et al. Radiographic emphysema predicts low bone mineral density in a tobacco- exposed cohort. Am J Respir Crit Care Med 2011;183:885–90.
[55] de Torres JP, Bastarrika G, Wisnivesky JP, et al. Assessing the relationship between lung cancer risk and emphysema detected on low-dose CT of the chest. Chest 2007;132:1932–8.
[56] Zulueta JJ, Wisnivesky JP, Henschke CI, et al. Emphysema scores predict death from COPD and lung cancer. Chest 2012;141:1216–23.
[57] Wilson DO, Weissfeld JL, Balkan A, et al. Association of radiographic emphysema and airflow obstruction with lung cancer. Am J Respir Crit Care Med 2008;178:738–44.
[58] Iwamoto H, Yokoyama A, Kitahara Y, et al. Airflow limitation in smokers is associated with subclinical atherosclerosis. Am J Respir Crit Care Med 2009;179:35–40.
[59] McAllister DA, Maclay JD, Mills NL, et al. Arterial stiffness is independently associated with emphysema severity in patients with chronic obstructive pulmonary disease. Am J Respir Crit Care Med 2007;176:1208–14.
[60] Nakano Y, Coxson HO, Bosan S, et al. Core to rind distribution of severe emphysema predicts outcome of lung volume reduction surgery. Am J Respir Crit Care Med 2001;164: 2195–9.
[61] Revel MP, Faivre JB, Remy-Jardin M, et al. Automated lobar quantification of emphysema in patients with severe COPD. Eur Radiol 2008;18:2723–30.
[62] Coxson HO, Whittall KP, Nakano Y, et al. Selection of patients for lung volume reduction surgery using a power law analysis of the computed tomographic scan. Thorax 2003;58: 510–14.
[63] Rogers RM, Coxson HO, Sciurba FC, et al. Preoperative severity of emphysema predictive of improvement after lung volume reduction surgery: use of CT morphometry. Chest 2000;118:1240–7.
[64] Washko GR, Martinez FJ, Hoffman EA, et al. Physiological and computed tomographic predictors of outcome from lung volume reduction surgery. Am J Respir Crit Care Med 2010;181:494–500.
[65] Brenner DJ, Hall EJ. Computed tomography—an increasing source of radiation exposure. N Engl J Med 2007;357:2277–84.
[66] Gierada DS, Pilgram TK, Whiting BR, et al. Comparison of standard- and low-radiation-dose CT for quantification of emphysema. AJR Am J Roentgenol 2007;188:42–7.
[67] Koyama H, Ohno Y, Yamazaki Y, et al. Quantitative and qualitative assessments of lung destruction and pulmonary functional loss from reduced-dose thin-section CT in pulmonary emphysema patients. Acad Radiol 2010;17:163–8.
[68] Yuan R, Mayo JR, Hogg JC, et al. The effects of radiation dose and CT manufacturer on measurements of lung densitometry. Chest 2007;132:617–23.
[69] King GG, Muller NL, Whittall KP, et al. An analysis algorithm for measuring airway lumen and wall areas from high- resolution computed tomographic data. Am J Respir Crit Care Med 2000;161:574–80.
[70] Yamashiro T, Matsuoka S, Estepar RS, et al. Quantitative assessment of bronchial wall attenuation with thin-section CT: an indicator of airflow limitation in chronic obstructive pulmonary disease. AJR Am J Roentgenol 2010;195:363–9.
[71] Reinhardt JM, D’Souza ND, Hoffman EA. Accurate measurement of intrathoracic airways. IEEE Trans Med Imaging 1997;16:820–7.
[72] Berger P, Perot V, Desbarats P, et al. Airway wall thickness in cigarette smokers: quantitative thin-section CT assessment. Radiology 2005;235:1055–64.
[73] Saba OI, Hoffman EA, Reinhardt JM. Maximizing quantitative accuracy of lung airway lumen and wall measures obtained from X-ray CT imaging. J Appl Physiol 2003;95:1063–75.
[74] Tschirren J, Hoffman EA, McLennan G, et al. Intrathoracic airway trees: segmentation and airway morphology analysis from low- dose CT scans. IEEE Trans Med Imaging 2005;24:1529–39.
[75] Nakano Y, Wong JC, de Jong PA, et al. The prediction of small airway dimensions using computed tomography. Am J Respir Crit Care Med 2005;171:142–6.
[76] Orlandi I, Moroni C, Camiciottoli G, et al. Chronic obstructive pulmonary disease: thin-section CT measurement of airway wall thickness and lung attenuation. Radiology 2005;234:604–10.
[77] Hasegawa M, Nasuhara Y, Onodera Y, et al. Airflow limitation and airway dimensions in chronic obstructive pulmonary disease. Am J Respir Crit Care Med 2006;173:1309–15.
[78] Montaudon M, Berger P, de Dietrich G, et al. Assessment of airways with three-dimensional quantitative thin-section CT: in vitro and in vivo validation. Radiology 2007;242:563–72.
[79] Palagyi K, Tschirren J, Hoffman EA, et al. Quantitative analysis of pulmonary airway tree structures. Comput Biol Med 2006;36:974–96.
[80] Tschirren J, McLennan G, Palagyi K, et al. Matching and anatomical labeling of human airway tree. IEEE Trans Med Imaging 2005;24:1540–7. [81] Kim V, Han MK, Vance GB, et al. The chronic bronchitic phenotype of COPD: an analysis of the COPDGene study. Chest 2011;140:626–33.
[82] Ohara T, Hirai T, Sato S, et al. Comparison of airway dimensions in different anatomic locations on chest CT in patients with COPD. Respirology 2006;11:579–85.
[83] Coxson HO, Quiney B, Sin DD, et al. Airway wall thickness assessed using computed tomography and optical coherence tomography. Am J Respir Crit Care Med 2008;177:1201–6.
[84] Matsuoka S, Kurihara Y, Yagihashi K, et al. Airway dimensions at inspiratory and expiratory multisection CT in chronic obstructive pulmonary disease: correlation with air- flow limitation. Radiology 2008;248:1042–9.
[85] Shimizu K, Hasegawa M, Makita H, et al. Comparison of airway remodelling assessed by computed tomography in asthma and COPD. Respir Med 2011;105:1275–83.
[86] Achenbach T, Weinheimer O, Biedermann A, et al. MDCT assessment of airway wall thickness in COPD patients using a new method: correlations with pulmonary function tests. Eur Radiol 2008;18:2731–8.
[87] Patel BD, Coxson HO, Pillai SG, et al. Airway wall thickening and emphysema show independent familial aggregation in chronic obstructive pulmonary disease. Am J Respir Crit Care Med 2008;178:500–5.
[88] Matsuoka S, Kurihara Y, Nakajima Y, et al. Serial change in airway lumen and wall thickness at thin-section CT in asymptomatic subjects. Radiology 2005;234:595–603.
[89] Ohara T, Hirai T, Sato S, et al. Longitudinal study of airway dimensions in chronic obstructive pulmonary disease using computed tomography. Respirology 2008;13:372–8.
[90] Vestbo J, Anderson W, Coxson HO, et al. Evaluation of COPD Longitudinally to Identify Predictive Surrogate End-points (ECLIPSE). Eur Respir J 2008;31:869–73.
[91] Hasegawa M, Makita H, Nasuhara Y, et al. Relationship between improved airflow limitation and changes in airway calibre induced by inhaled anticholinergic agents in COPD. Thorax 2009;64:332–8.
[92] Matsuoka S, Washko GR, Dransfield MT, et al. Quantitative CT measurement of cross-sectional area of small pulmonary vessel in COPD: correlations with emphysema and airflow limitation. Acad Radiol 2010;17:93–9.
[93] Matsuoka S, Washko GR, Yamashiro T, et al. Pulmonary hypertension and computed tomography measurement of small pulmonary vessels in severe emphysema. Am J Respir Crit Care Med 2010;181:218–25.
[94] Matsuoka S, Yamashiro T, Diaz A, et al. The relationship between small pulmonary vascular alteration and aortic atherosclerosis in chronic obstructive pulmonary disease: quantitative CT analysis. Acad Radiol 2011;18:40–6.
[95] Boschetto P, Quintavalle S, Zeni E, et al. Association between markers of emphysema and more severe chronic obstructive pulmonary disease. Thorax 2006;61:1037–42.
[96] Fujimoto K, Kitaguchi Y, Kubo K, et al. Clinical analysis of chronic obstructive pulmonary disease phenotypes classified using high-resolution computed tomography. Respirology 2006;11:731–40.
[97] Kitaguchi Y, Fujimoto K, Kubo K, et al. Characteristics of COPD phenotypes classified according to the findings of HRCT. Respir Med 2006;100:1742–52.
[98] Tashkin DP, Celli B, Senn S, et al. A 4-year trial of tiotropium in chronic obstructive pulmonary disease. N Engl J Med 2008;359:1543–54.
[99] Nakano Y, Muller NL, King GG, et al. Quantitative assessment of airway remodeling using high-resolution CT. Chest 2002;122:271S–5S.
[100] Boschetto P, Miniati M, Miotto D, et al. Predominant emphysema phenotype in chronic obstructive pulmonary. Eur Respir J 2003;21:450–4.
[101] Lee JH, Lee YK, Kim EK, et al. Responses to inhaled long- acting beta-agonist and corticosteroid according to COPD subtype. Respir Med 2010;104:542–9.
[102] Coxson HO. Quantitative computed tomography assessment of airway wall dimensions: current status and poten- tial applications for phenotyping chronic obstructive pulmonary disease. Proc Am Thorac Soc 2008;5:940–5.
[103] Ito I, Nagai S, Hoshino Y, et al. Risk and severity of COPD is associated with the group-specific component of serum globulin 1F allele. Chest 2004;125:63–70.
[104] Kong X, Cho MH, Anderson W, et al. Genome-wide association study identifies BICD1 as a susceptibility gene for emphysema. Am J Respir Crit Care Med 2011;183:43–9.
[105] Pillai SG, Kong X, Edwards LD, et al. Loci identified by genome-wide association studies influence different disease-related phenotypes in chronic obstructive pulmonary disease. Am J Respir Crit Care Med 2010;182:1498–505.
[106] Atkinson JJ, Lutey BA, Suzuki Y, et al. The role of matrix metalloproteinase-9 in cigarette smoke-induced emphysema. Am J Respir Crit Care Med 2011;183:876–84.
[107] Ito I, Nagai S, Handa T, et al. Matrix metalloproteinase-9 promoter polymorphism associated with upper lung dominant emphysema. Am J Respir Crit Care Med 2005;172:1378–82.
[108] DeMeo DL, Hersh CP, Hoffman EA, et al. Genetic determinants of emphysema distribution in the national emphysema treatment trial. Am J Respir Crit Care Med 2007;176:42–8.
[109] Hizawa N, Makita H, Nasuhara Y, et al. Functional single nucleotide polymorphisms of the CCL5 gene and nonemphysematous phenotype in COPD patients. Eur Respir J 2008;32:372–8.
[110] Haq I, Lowrey GE, Kalsheker N, et al. Matrix metalloproteinase- 12 (MMP-12) SNP affects MMP activity, lung macrophage infiltration and protects against emphysema in COPD. Thorax 2011;66:970–6.
[111] Kim WJ, Oh YM, Sung J, et al. CT scanning-based phenotypes vary with ADRB2 polymorphisms in chronic obstructive pulmonary disease. Respir Med 2009;103:98–103.